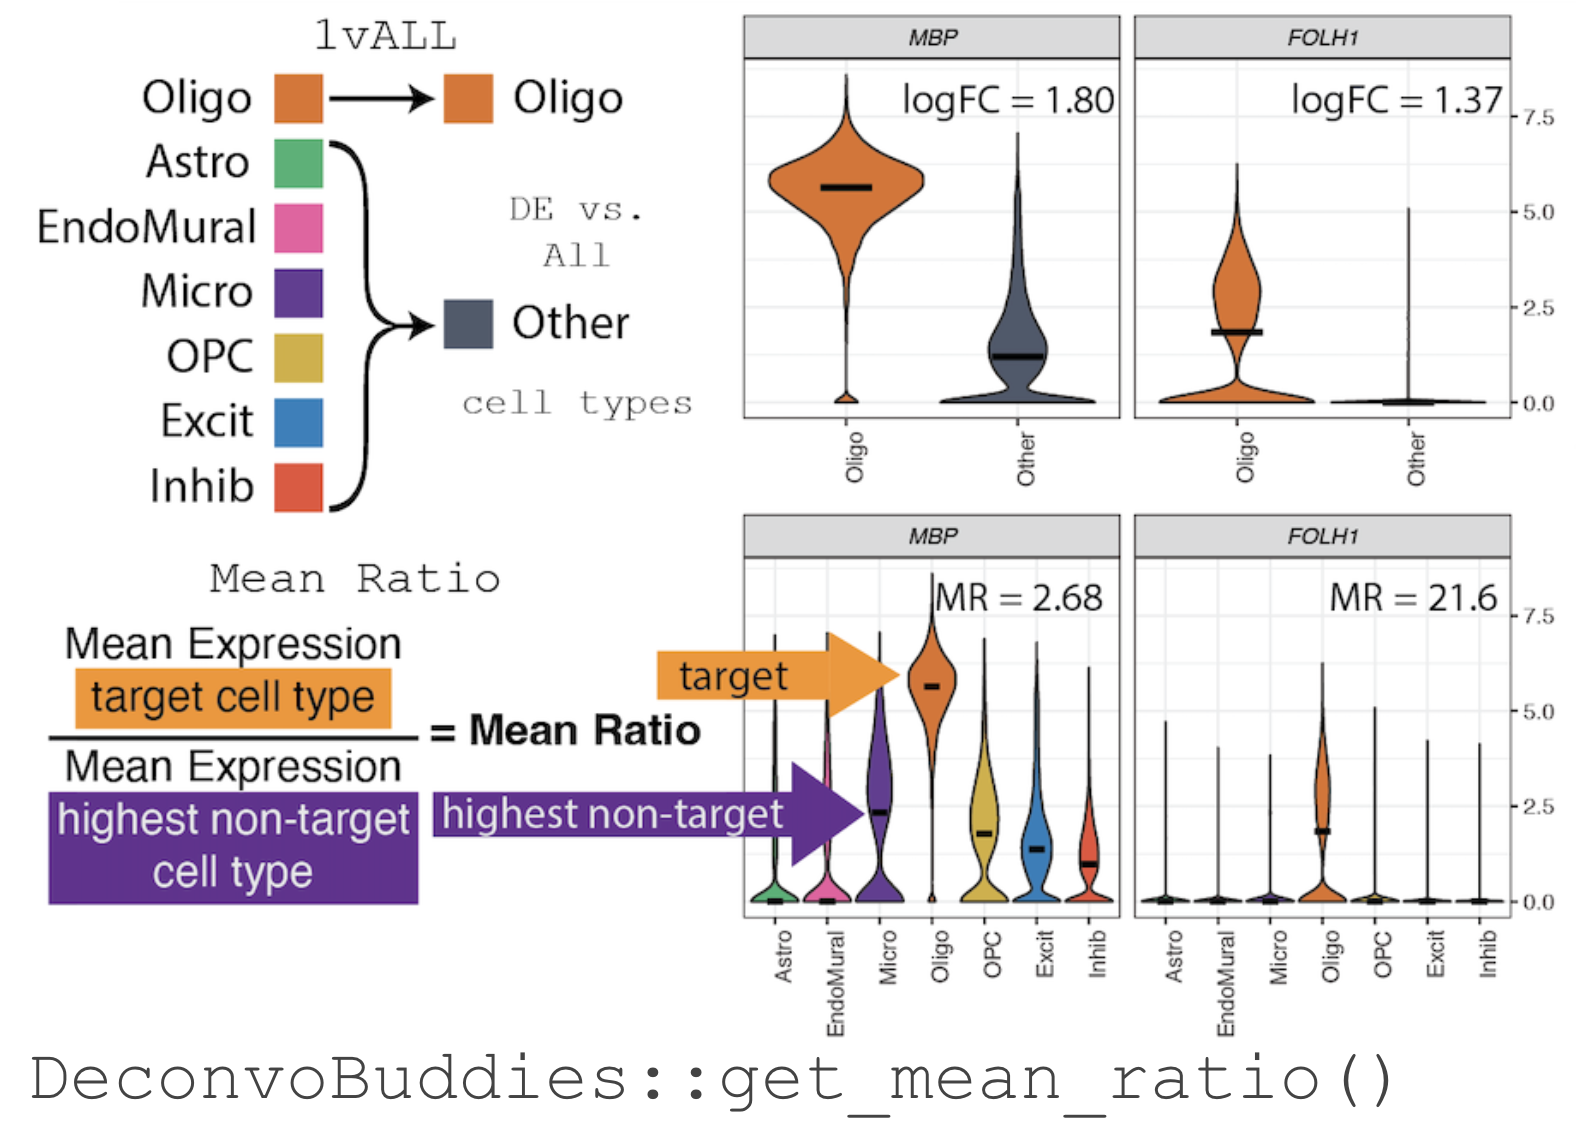
## The *Mean Ratio* Method To capture genes with more cell type specific expression and less noise, we developed the ***Mean Ratio*** method. The *Mean Ratio* method works by selecting genes with large differences between gene expression in the target cell type and the closest non-target cell type, by evaluating genes by their `MeanRatio` metric. We calculate the `MeanRatio` for a target cell type for each gene by **dividing the mean expression of the target cell by the mean expression of the next highest non-target cell type**. Genes with the highest `MeanRatio` values are selected as marker genes. In the above example, **Oligo** is the target cell type. Micro has the highest mean expression out of the other non-target (not Oligo) cell types. The `MeanRatio = (mean expression Oligo) / (mean expression Micro)`, for *MBP* `MeanRatio` = 2.68 for gene *FOLH1* `MeanRatio` is much higher 21.6 showing FOLH1 is the better marker gene (in contrast to ranking by *1vALL* log FC). In the violin plots you can see that expression of *FOLH1* is much more specific to Oligo than MBP, supporting the ranking by `MeanRatio`. We have implemented the ***Mean Ratio*** method in this R package with the function `get_mean_ratio()`. This vignette will cover our process for marker gene selection. ## Goals of this Vignette We will be demonstrating how to use `DeconvoBuddies` tools when finding cell type marker genes in single cell RNA-seq data via the *MeanRatio* method. 1. Install and load required packages 2. Download DLPFC snRNA-seq data 3. Find MeanRatio marker genes with `DeconvoBuddies::get_mean_ratio()` 4. Find 1vALL marker genes with `DeconvoBuddies::findMarkers_1vALL()` 5. Compare marker gene selection 6. Visualize marker genes expression with `DeconcoBuddies::plot_gene_express()` and related functions # 1. Install and load required packages `R` is an open-source statistical environment which can be easily modified to enhance its functionality via packages. `r Biocpkg("DeconvoBuddies")` is a `R` package available via the [Bioconductor](http://bioconductor.org) repository for packages. `R` can be installed on any operating system from [CRAN](https://cran.r-project.org/) after which you can install `r Biocpkg("DeconvoBuddies")` by using the following commands in your `R` session: ## Install `DeconvoBuddies` ```{r "install", eval = FALSE} if (!requireNamespace("BiocManager", quietly = TRUE)) { install.packages("BiocManager") } BiocManager::install("DeconvoBuddies") ## Check that you have a valid Bioconductor installation BiocManager::valid() ``` ## Load Other Packages Let's load the packages will use in this vignette. ```{r "load_packages", message=FALSE, warning=FALSE} ## Packages for different types of RNA-seq data structures in R library("SingleCellExperiment") ## For downloading data library("spatialLIBD") ## Other helper packages for this vignette library("dplyr") library("ggplot2") ## Our main package library("DeconvoBuddies") ``` # 2. Download DLPFC snRNA-seq data. Here we will download single nucleus RNA-seq data from the Human DLPFC with 77k nuclei x 36k genes [@huuki-myers2024]. This data is stored in a `SingleCellExperiment` object. The nuclei in this dataset are labeled by cell types at a few resolutions, we will focus on the "broad" resolution that contains seven cell types. ```{r "load snRNA-seq"} ## Use spatialLIBD to fetch the snRNA-seq dataset sce_path_zip <- fetch_deconvo_data("sce") ## unzip and load the data sce_path <- unzip(sce_path_zip, exdir = tempdir()) sce <- HDF5Array::loadHDF5SummarizedExperiment( file.path(tempdir(), "sce_DLPFC_annotated") ) # lobstr::obj_size(sce) # 172.28 MB ## exclude Ambiguous cell type sce <- sce[, sce$cellType_broad_hc != "Ambiguous"] sce$cellType_broad_hc <- droplevels(sce$cellType_broad_hc) ## Check the broad cell type distribution table(sce$cellType_broad_hc) ## We're going to subset to the first 5k genes to save memory ## In a real application you'll want to use the full dataset sce <- sce[seq_len(5000), ] ## check the final dimensions of the dataset dim(sce) ``` # 3. Find MeanRatio marker genes To find *Mean Ratio* marker genes for the data in `sce` we'll use the function `DeconvoBuddies::get_mean_ratio()`, this function takes a `SingleCellExperiment` object `sce` the name of the column in the `colData(sce)` that contains the cell type annotations of interest (here we'll use `cellType_broad_hc`), and optionally you can also supply additional column names from the `rowData(sce)` to add the `gene_name` and/or `gene_ensembl` information to the table output of `get_mean_ratio`. ```{r "Run get_mean_ratio"} # calculate the Mean Ratio of genes for each cell type in sce marker_stats_MeanRatio <- get_mean_ratio( sce = sce, # sce is the SingleCellExperiment with our data assay_name = "logcounts", ## assay to use, we recommend logcounts [default] cellType_col = "cellType_broad_hc", # column in colData with cell type info gene_ensembl = "gene_id", # column in rowData with ensembl gene ids gene_name = "gene_name" # column in rowData with gene names/symbols ) ``` The function `get_mean_ratio()` returns a `tibble` with the following columns: - `gene` is the name of the gene (from rownames(`sce`)). - `cellType.target` is the cell type we're finding marker genes for. - `mean.target` is the mean expression of `gene` for `cellType.target`. - `cellType.2nd` is the second highest non-target cell type. - `mean.2nd` is the mean expression of `gene` for `cellType.2nd`. - `MeanRatio` is the ratio of `mean.target/mean.2nd`. - `MeanRatio.rank` is the rank of `MeanRatio` for the cell type. - `MeanRatio.anno` is an annotation of the `MeanRatio` calculation helpful for plotting. - `gene_ensembl` & `gene_name` optional cols from `rowData(sce)` specified by the user to add gene information ```{r "Explore get_mean_ratio output"} ## Explore the tibble output marker_stats_MeanRatio ## genes with the highest MeanRatio are the best marker genes for each cell type marker_stats_MeanRatio |> filter(MeanRatio.rank == 1) ``` # 4. Find 1vALL marker genes To further explore cell type marker genes it can be helpful to also calculate the 1vALL stats for the dataset. To help with this we have included the function `DeconvoBuddies::findMarkers_1vALL()`, which is a wrapper for `scran::findMarkers()` that iterates through cell types and creates an table output in a compatible with the output `DeconvoBuddies::get_mean_ratio()`. Similarity to `get_mean_ratio` this function requires the `sce` object, `cellType_col` to define cell types, and `assay_name`. But `findMarkers_1vALL()` also takes a model (`mod`) to use as design in `scran::findMarkers()`, in this example we will control for donor which is stored as `BrNum`. Note this function can take a bit of time to run. We have saved the output as `data("marker_stats_1vAll")` to speed-up the runtime of this vignette. ```{r `Run findMarkers_1vALL`} ## Run 1vALL DE to find markers for each cell type - takes 5min+ # marker_stats_1vAll <- findMarkers_1vAll( # sce = sce, # sce is the SingleCellExperiment with our data # assay_name = "counts", # cellType_col = "cellType_broad_hc", # column in colData with cell type info # mod = "~BrNum" # Control for donor stored in "BrNum" with mod # ) ## load 1vAll data to save time, data is equivalent to the above code data("marker_stats_1vAll") ``` The function `findMarkers_1vALL()` returns a `tibble` with the following columns: - `gene` is the name of the gene (from rownames(`sce`)). - `logFC` the log fold change from the DE test - `log.p.value` the log of the p-value of the DE test - `log.FDR` the log of the False Discovery Rate adjusted p.value - `std.logFC` the standard logFC - `cellType.target` the cell type we're finding marker genes for - `std.logFC.rank` the rank of `std.logFC` for each cell type - `std.logFC.anno` is an annotation of the `std.logFC` value helpful for plotting. ```{r "Explore findMarkers_1vALL output"} ## Explore the tibble output marker_stats_1vAll ## genes with the highest MeanRatio are the best marker genes for each cell type marker_stats_1vAll |> filter(std.logFC.rank == 1) ``` As this is a differential expression test, you can create volcano plots to explore the outputs. 🌋 Note that with the default option "up" for direction only up-regulated genes are considered marker candidates, so all genes with logFC\<1 will have a p.value=0. As a results these plots will only have the right half of the volcano shape. If you'd like all p-values set `findMarkers_1vALL(direction="any")`. ```{r, "volcano plots"} # Create volcano plots of DE stats from 1vALL marker_stats_1vAll |> ggplot(aes(logFC, -log.p.value)) + geom_point() + facet_wrap(~cellType.target) + geom_vline(xintercept = c(1, -1), linetype = "dashed", color = "red") ``` # 5. Compare Marker Gene Selection Let's join the two `marker_stats` tables together to compare the findings of the two methods. Note as we are using a subset of data for this example, for some genes there is not enough data to test and 1vALL will have some missing results. ```{r "join marker_stats"} ## join the two marker_stats tables marker_stats <- marker_stats_MeanRatio |> left_join(marker_stats_1vAll, by = join_by(gene, cellType.target)) ## Check stats for our top genes marker_stats |> filter(MeanRatio.rank == 1) |> select(gene, cellType.target, MeanRatio, MeanRatio.rank, std.logFC, std.logFC.rank) ``` ## Hockey Stick Plots Plotting the values of Mean Ratio vs. standard log fold change (from 1vAll) we create what we call "hockey stick plots" 🏒. These plots help visualize the distribution of `MeanRatio` and standard `logFC` values.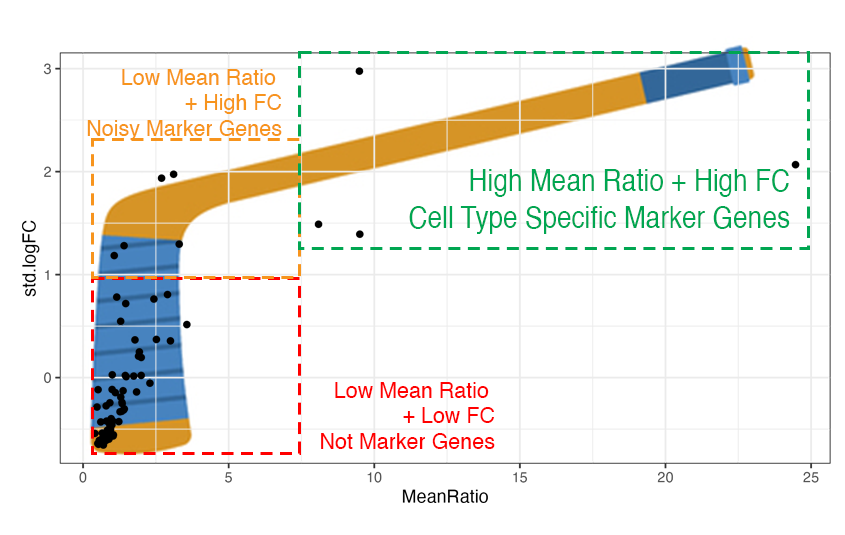
Typically for a cell type see most genes have low Mean Ratio and low fold change, these genes are not marker genes (red box in illustration above on the bottom left side). Genes with higher fold change from 1vALL are better marker gene candidates, but most have low *MeanRatio* values indicating that one or more non-target cell types have high expression for that gene, causing noise (orange box on the top left side). Genes with high M*eanRatio* typically also have high *1vALL* standard fold changes, these are cell type specific marker genes we are selecting for (green box on the top right side). ```{r "hockey stick plots"} # create hockey stick plots to compare MeanRatio and standard logFC values. marker_stats |> ggplot(aes(MeanRatio, std.logFC)) + geom_point() + facet_wrap(~cellType.target) ``` We can see a "hockey stick" shape in most of the cell types, with a few marker genes with high values for both `logFC` and `MeanRatio`. # 6. Visualize Marker Genes Expression An important step for ensuring you have selected high quality marker genes is to visualize their expression over the cell types in the dataset. `DeconvoBuddies` has several functions to help quickly plot gene expression at a few levels: `plot_gene_express()` plots the expression of one or more genes as a violin plot. ```{r, "plot_gene_express"} ## plot expression of two genes from a list plot_gene_express( sce = sce, category = "cellType_broad_hc", genes = c("SLC2A1", "CREG2") ) ``` `plot_marker_express()` plots the top n marker genes for a specified cell type based on the values from `marker_stats`. Annotations for the details of the *MeanRatio* value + calculation are added to each panel. ```{r, "plot_marker_express MeanRatio"} # plot the top 10 MeanRatio genes for Excit plot_marker_express( sce = sce, stats = marker_stats, cell_type = "Excit", n_genes = 10, cellType_col = "cellType_broad_hc" ) ``` In these violin plots we can see these genes have high expression in the target cell type Excit , and mostly low expression nuclei in the other cell types, sometimes even no expression. This function defaults to selecting genes by the *MeanRatio* stats, but can also be used to plot the *1vAll* genes. ```{r, "plot_marker_express logFC"} # plot the top 10 1vAll genes for Excit plot_marker_express( sce = sce, stats = marker_stats, cell_type = "Excit", n_genes = 10, rank_col = "std.logFC.rank", ## use logFC cols from 1vALL anno_col = "std.logFC.anno", cellType_col = "cellType_broad_hc" ) ``` We can see in the top *1vALL* genes there is some expression of these genes in Inhib nuclei in addition to the target cell type Excit. `plot_marker_express_ALL()` plots the top marker genes for all cell types. This is a quick and easy way to look at the the top markers in your dataset, which is an important step and can help identify genes with multimodal distributions that may confound the MeanRatio method. ```{r, plot_marker_express_ALL, eval = FALSE} # plot the top 10 1vAll genes for all cell types print(plot_marker_express_ALL( sce = sce, stats = marker_stats, n_genes = 10, cellType_col = "cellType_broad_hc" )) ``` The violin plots can also be directly printed to a PDF file using the built in argument `plot_marker_express_ALL(pdf = "my_marker_genes.pdf")` for portability and easy sharing. # Summary In this vignette we covered the importance of finding marker genes, and introduced our method for finding cell type specific genes *MeanRatio*. We covered how to find and compare *MeanRatio* marker genes with `get_mean_ratio()`, and *1vALL* marker genes with `findMarkers_1vALL()`. And finally, how to visualize the expression of these marker genes with `plot_marker_express()` and related functions. **Next Steps** For an example of how to use these marker genes in a deconvolution workflow, check out [Vignette: Deconvolution Benchmark in Human DLPFC](https://research.libd.org/DeconvoBuddies/articles/Deconvolution_Benchmark_DLPFC.html). We hope this vignette and *DeconvoBuddies* helps you with your research goals! Thanks for reading 😁 # Reproducibility The `r Biocpkg("DeconvoBuddies")` package `r Citep(bib[["DeconvoBuddies"]])` was made possible thanks to: - R `r Citep(bib[["R"]])` - `r Biocpkg("BiocStyle")` `r Citep(bib[["BiocStyle"]])` - `r CRANpkg("knitr")` `r Citep(bib[["knitr"]])` - `r CRANpkg("RefManageR")` `r Citep(bib[["RefManageR"]])` - `r CRANpkg("rmarkdown")` `r Citep(bib[["rmarkdown"]])` - `r CRANpkg("sessioninfo")` `r Citep(bib[["sessioninfo"]])` - `r CRANpkg("testthat")` `r Citep(bib[["testthat"]])` This package was developed using `r BiocStyle::Biocpkg("biocthis")`. `R` session information. ```{r reproduce3, echo=FALSE} ## Session info library("sessioninfo") options(width = 120) session_info() ``` # Bibliography This vignette was generated using `r Biocpkg("BiocStyle")` `r Citep(bib[["BiocStyle"]])` with `r CRANpkg("knitr")` `r Citep(bib[["knitr"]])` and `r CRANpkg("rmarkdown")` `r Citep(bib[["rmarkdown"]])` running behind the scenes. Citations made with `r CRANpkg("RefManageR")` `r Citep(bib[["RefManageR"]])`. ```{r vignetteBiblio, results = "asis", echo = FALSE, warning = FALSE, message = FALSE} ## Print bibliography PrintBibliography(bib, .opts = list(hyperlink = "to.doc", style = "html")) ```